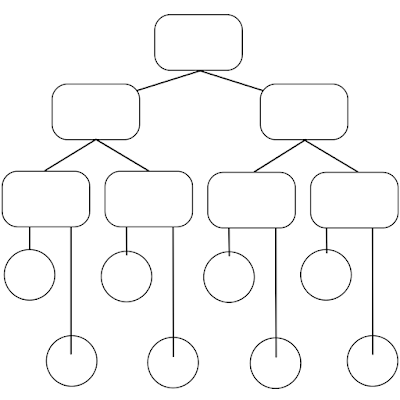
Organize your notes with these graphic organizer charts
What are examples of graphic organizer charts that students can use to keep track of their research notes and ideas?
Introduction
Research is a crucial part of any academic work. Whether you're doing a project or preparing for an upcoming exam, gathering information is your top priority. However, it can be challenging to keep all the facts, ideas, and data organized. Luckily, there's a solution! Graphic organizer charts. These helpful tools can help you keep track of your research notes, ideas, and findings. In this post, we'll explore some of the best examples of graphic organizer charts that students can use to organize their research notes and ideas.
Different graphic organizer examples to try out
1. Venn Diagrams
One of the most popular graphic organizer charts is the Venn diagram. It consists of two or more overlapping circles that represent the similarities and differences between two or more sets of data. As a student, you can use Venn diagrams to compare and contrast information, such as different theories, characters, events, or concepts. For instance, you can use a Venn diagram to compare and contrast two historical figures or two literary works. You can also use a Venn diagram to explore the intersections between two disciplines, such as science and literature.
 | ||
| Venn diagram. The overlapping space is used to list similarities between the two concepts/people/events/subjects being explored. |
2. Mind Maps
Another powerful tool for organizing your research notes is the mind map. This type of graphic organizer chart lets you create a visual web of interconnected ideas, concepts, and keywords. You start with a central idea or theme and then add branches that lead to related topics or categories. You can use colors, symbols, and images to make your mind map more engaging and memorable. Mind maps are perfect for brainstorming, outlining, and summarizing complex information, such as theories, arguments, or historical events.
 |
| A typical mind map template. |
3. Flowcharts
If you need to represent a series of steps or processes, a flowchart might be your best choice. Flowcharts are visual diagrams that show the sequence of events or actions from beginning to end. They consist of various shapes, such as circles, rectangles, diamonds, and arrows, that indicate the different stages or decisions of a process. Flowcharts can help you track the progress of your research, identify potential roadblocks, and analyze the logic of a system or a concept.
 |
| Flowchart example |
4. T-Charts
A T-Chart is a simple but effective tool for comparing and contrasting two different categories of information. It consists of a vertical column on the left and right side of a horizontal line. You can use it to categorize data based on different criteria, such as pros and cons, advantages and disadvantages, or causes and effects. For instance, you can use a T-Chart to compare two political candidates or two mathematical formulas.
 |
| The T-chart is a classic graphic organizer, and just like the Venn diagram, quick and easy to set up. |
5. Concept Maps
Concept maps are another type of graphic organizer chart that can help you visualize complex ideas, relationships, and processes. Unlike mind maps, which emphasize the central theme, concept maps allow you to explore multiple connections between different concepts or categories. They consist of nodes or bubbles that represent key concepts or categories, and lines that link them together according to their relationships. You can use concept maps to analyze the structure of a text or a system, to generate new ideas, or to revise and summarize your research notes.
 |
| Concept map model |
Conclusion
In conclusion, graphic organizer charts are powerful tools for keeping track of your research notes and ideas. By using visual aids, you can organize and understand complex information more effectively, and enhance your critical thinking and creative skills. Whether you prefer Venn diagrams, mind maps, flowcharts, T-charts, or concept maps, there's a perfect tool for your needs. So, next time you conduct research, don't forget to use a graphic organizer chart and see the difference!
No comments:
Post a Comment